


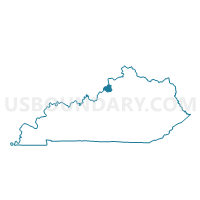
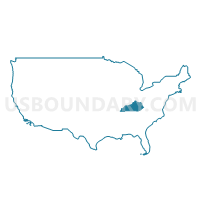
Pewee Valley CCD, Oldham County, Kentucky
About
Outline

Summary
| Unique Area Identifier | 132138 |
| Name | Pewee Valley CCD |
| County | Oldham County |
| State | Kentucky |
| Area (square miles) | 95.74 |
| Land Area (square miles) | 90.30 |
| Water Area (square miles) | 5.45 |
| % of Land Area | 94.31 |
| % of Water Area | 5.69 |
| Latitude of the Internal Point | 38.37915400 |
| Longtitude of the Internal Point | -85.51212740 |
| Total Population | 36,147 |
| Total Housing Units | 12,919 |
| Total Households | 12,159 |
| Median Age | 39.1 |
Maps

Graphs
Select a template below for downloading or customizing gragh for Pewee Valley CCD, Oldham County, Kentucky


Neighbors
Neighoring County Subdivision (by Name) Neighboring County Subdivision on the Map
- Charlestown township, Clark County, IN
- East Jefferson CCD, Jefferson County, KY
- La Grange CCD, Oldham County, KY
- Northeast Jefferson CCD, Jefferson County, KY
- Owen township, Clark County, IN
- Simpsonville CCD, Shelby County, KY
- Utica township, Clark County, IN
Top 10 Neighboring Place (by Population) Neighboring Place on the Map
- Louisville/Jefferson County metro government (balance), KY (597,337)
- Jeffersonville city, IN (44,953)
- Charlestown city, IN (7,585)
- Buckner CDP, KY (5,837)
- Prospect city, KY (4,698)
- Crestwood city, KY (4,531)
- Orchard Grass Hills city, KY (1,595)
- Pewee Valley city, KY (1,456)
- Coldstream city, KY (1,100)
- Goshen city, KY (909)
Top 10 Neighboring Unified School District (by Population) Neighboring Unified School District on the Map
- Jefferson County School District, KY (738,704)
- Greater Clark County Schools, IN (74,124)
- Oldham County School District, KY (60,316)
- Shelby County School District, KY (42,074)
Top 10 Neighboring State Legislative District Lower Chamber (by Population) Neighboring State Legislative District Lower Chamber on the Map
- State House District 71, IN (67,720)
- State House District 66, IN (64,746)
- State House District 48, KY (57,316)
- State House District 58, KY (55,670)
- State House District 59, KY (55,004)
- State House District 47, KY (46,003)
Top 10 Neighboring State Legislative District Upper Chamber (by Population) Neighboring State Legislative District Upper Chamber on the Map
- State Senate District 45, IN (138,973)
- State Senate District 26, KY (134,003)
- State Senate District 20, KY (133,454)
- State Senate District 36, KY (125,909)
Top 10 Neighboring 111th Congressional District (by Population) Neighboring 111th Congressional District on the Map
- Congressional District 2, KY (760,032)
- Congressional District 4, KY (741,464)
- Congressional District 9, IN (729,076)
- Congressional District 3, KY (721,626)
Top 10 Neighboring Census Tract (by Population) Neighboring Census Tract on the Map
- Census Tract 103.11, Jefferson County, KY (7,146)
- Census Tract 405.02, Shelby County, KY (6,424)
- Census Tract 304.01, Oldham County, KY (6,416)
- Census Tract 103.14, Jefferson County, KY (6,230)
- Census Tract 306.01, Oldham County, KY (5,921)
- Census Tract 307.02, Oldham County, KY (5,686)
- Census Tract 507.01, Clark County, IN (5,557)
- Census Tract 75.02, Jefferson County, KY (5,339)
- Census Tract 302, Oldham County, KY (5,164)
- Census Tract 306.02, Oldham County, KY (5,006)
Top 10 Neighboring 5-Digit ZIP Code Tabulation Area (by Population) Neighboring 5-Digit ZIP Code Tabulation Area on the Map
- 47130, IN (44,722)
- 40245, KY (30,109)
- 40241, KY (28,988)
- 40031, KY (22,863)
- 40014, KY (19,986)
- 40059, KY (16,708)
- 47111, IN (14,533)
- 40026, KY (5,458)
- 40056, KY (3,263)
- 40010, KY (587)
Data
Demographic, Population, Households, and Housing Units
** Data sources from census 2010 **
Show Data on Map
Download Full List as CSV
Download Quick Sheet as CSV
| Subject | This Area | Oldham County | Kentucky | National |
|---|---|---|---|---|
| POPULATION | ||||
| Total Population Map | 36,147 | 60,316 | 4,339,367 | 308,745,538 |
| POPULATION, HISPANIC OR LATINO ORIGIN | ||||
| Not Hispanic or Latino Map | 35,122 | 58,183 | 4,206,531 | 258,267,944 |
| Hispanic or Latino Map | 1,025 | 2,133 | 132,836 | 50,477,594 |
| POPULATION, RACE | ||||
| White alone Map | 33,698 | 54,904 | 3,809,537 | 223,553,265 |
| Black or African American alone Map | 874 | 2,620 | 337,520 | 38,929,319 |
| American Indian and Alaska Native alone Map | 64 | 170 | 10,120 | 2,932,248 |
| Asian alone Map | 652 | 797 | 48,930 | 14,674,252 |
| Native Hawaiian and Other Pacific Islander alone Map | 12 | 30 | 2,501 | 540,013 |
| Some Other Race alone Map | 296 | 788 | 55,551 | 19,107,368 |
| Two or More Races Map | 551 | 1,007 | 75,208 | 9,009,073 |
| POPULATION, SEX | ||||
| Male Map | 17,796 | 31,737 | 2,134,952 | 151,781,326 |
| Female Map | 18,351 | 28,579 | 2,204,415 | 156,964,212 |
| POPULATION, AGE (18 YEARS) | ||||
| 18 years and over Map | 24,809 | 43,520 | 3,315,996 | 234,564,071 |
| Under 18 years | 11,338 | 16,796 | 1,023,371 | 74,181,467 |
| POPULATION, AGE | ||||
| Under 5 years | 2,157 | 3,420 | 282,367 | 20,201,362 |
| 5 to 9 years | 3,290 | 4,883 | 282,888 | 20,348,657 |
| 10 to 14 years | 3,718 | 5,374 | 284,154 | 20,677,194 |
| 15 to 17 years | 2,173 | 3,119 | 173,962 | 12,954,254 |
| 18 and 19 years | 788 | 1,255 | 122,833 | 9,086,089 |
| 20 years | 253 | 460 | 61,268 | 4,519,129 |
| 21 years | 226 | 475 | 58,657 | 4,354,294 |
| 22 to 24 years | 717 | 1,574 | 170,043 | 12,712,576 |
| 25 to 29 years | 1,131 | 2,790 | 285,296 | 21,101,849 |
| 30 to 34 years | 1,634 | 3,360 | 280,920 | 19,962,099 |
| 35 to 39 years | 2,543 | 4,485 | 285,411 | 20,179,642 |
| 40 to 44 years | 3,342 | 5,422 | 291,251 | 20,890,964 |
| 45 to 49 years | 3,540 | 5,662 | 323,642 | 22,708,591 |
| 50 to 54 years | 3,027 | 5,017 | 319,455 | 22,298,125 |
| 55 to 59 years | 2,405 | 4,001 | 288,027 | 19,664,805 |
| 60 and 61 years | 881 | 1,466 | 106,469 | 7,113,727 |
| 62 to 64 years | 1,207 | 1,980 | 144,497 | 9,704,197 |
| 65 and 66 years | 586 | 1,011 | 78,497 | 5,319,902 |
| 67 to 69 years | 736 | 1,315 | 107,167 | 7,115,361 |
| 70 to 74 years | 758 | 1,330 | 139,650 | 9,278,166 |
| 75 to 79 years | 469 | 850 | 105,392 | 7,317,795 |
| 80 to 84 years | 302 | 552 | 78,313 | 5,743,327 |
| 85 years and over | 264 | 515 | 69,208 | 5,493,433 |
| MEDIAN AGE BY SEX | ||||
| Both sexes Map | 39.10 | 39.00 | 38.10 | 37.20 |
| Male Map | 38.80 | 38.50 | 36.70 | 35.80 |
| Female Map | 39.30 | 39.50 | 39.30 | 38.50 |
| HOUSEHOLDS | ||||
| Total Households Map | 12,159 | 19,431 | 1,719,965 | 116,716,292 |
| HOUSEHOLDS, HOUSEHOLD TYPE | ||||
| Family households: Map | 10,161 | 15,748 | 1,149,905 | 77,538,296 |
| Husband-wife family Map | 8,767 | 13,264 | 848,324 | 56,510,377 |
| Other family: Map | 1,394 | 2,484 | 301,581 | 21,027,919 |
| Male householder, no wife present Map | 409 | 721 | 82,545 | 5,777,570 |
| Female householder, no husband present Map | 985 | 1,763 | 219,036 | 15,250,349 |
| Nonfamily households: Map | 1,998 | 3,683 | 570,060 | 39,177,996 |
| Householder living alone Map | 1,622 | 3,012 | 473,447 | 31,204,909 |
| Householder not living alone Map | 376 | 671 | 96,613 | 7,973,087 |
| HOUSEHOLDS, HISPANIC OR LATINO ORIGIN OF HOUSEHOLDER | ||||
| Not Hispanic or Latino householder: Map | 11,937 | 18,963 | 1,685,985 | 103,254,926 |
| Hispanic or Latino householder: Map | 222 | 468 | 33,980 | 13,461,366 |
| HOUSEHOLDS, RACE OF HOUSEHOLDER | ||||
| Householder who is White alone | 11,513 | 18,320 | 1,540,334 | 89,754,352 |
| Householder who is Black or African American alone | 284 | 505 | 128,856 | 14,129,983 |
| Householder who is American Indian and Alaska Native alone | 19 | 43 | 4,014 | 939,707 |
| Householder who is Asian alone | 173 | 206 | 15,476 | 4,632,164 |
| Householder who is Native Hawaiian and Other Pacific Islander alone | 5 | 10 | 667 | 143,932 |
| Householder who is Some Other Race alone | 70 | 179 | 13,756 | 4,916,427 |
| Householder who is Two or More Races | 95 | 168 | 16,862 | 2,199,727 |
| HOUSEHOLDS, HOUSEHOLD TYPE BY HOUSEHOLD SIZE | ||||
| Family households: Map | 10,161 | 15,748 | 1,149,905 | 77,538,296 |
| 2-person household Map | 3,575 | 5,841 | 512,506 | 31,882,616 |
| 3-person household Map | 2,299 | 3,626 | 279,227 | 17,765,829 |
| 4-person household Map | 2,649 | 3,831 | 215,271 | 15,214,075 |
| 5-person household Map | 1,149 | 1,687 | 92,558 | 7,411,997 |
| 6-person household Map | 373 | 564 | 32,372 | 3,026,278 |
| 7-or-more-person household Map | 116 | 199 | 17,971 | 2,237,501 |
| Nonfamily households: Map | 1,998 | 3,683 | 570,060 | 39,177,996 |
| 1-person household Map | 1,622 | 3,012 | 473,447 | 31,204,909 |
| 2-person household Map | 315 | 565 | 79,041 | 6,360,012 |
| 3-person household Map | 40 | 67 | 11,214 | 992,156 |
| 4-person household Map | 17 | 30 | 4,493 | 411,171 |
| 5-person household Map | 1 | 4 | 1,290 | 126,634 |
| 6-person household Map | 3 | 5 | 354 | 48,421 |
| 7-or-more-person household Map | 0 | 0 | 221 | 34,693 |
| HOUSING UNITS | ||||
| Total Housing Units Map | 12,919 | 20,688 | 1,927,164 | 131,704,730 |
| HOUSING UNITS, OCCUPANCY STATUS | ||||
| Occupied Map | 12,159 | 19,431 | 1,719,965 | 116,716,292 |
| Vacant Map | 760 | 1,257 | 207,199 | 14,988,438 |
| HOUSING UNITS, OCCUPIED, TENURE | ||||
| Owned with a mortgage or a loan Map | 8,747 | 13,266 | 757,084 | 52,979,430 |
| Owned free and clear Map | 2,115 | 3,374 | 424,187 | 23,006,644 |
| Renter occupied Map | 1,297 | 2,791 | 538,694 | 40,730,218 |
| HOUSING UNITS, VACANT, VACANCY STATUS | ||||
| For rent Map | 98 | 201 | 56,960 | 4,137,567 |
| Rented, not occupied Map | 9 | 12 | 3,059 | 206,825 |
| For sale only Map | 269 | 430 | 27,286 | 1,896,796 |
| Sold, not occupied Map | 55 | 74 | 8,687 | 421,032 |
| For seasonal, recreational, or occasional use Map | 127 | 211 | 38,616 | 4,649,298 |
| For migrant workers Map | 0 | 0 | 627 | 24,161 |
| Other vacant Map | 202 | 329 | 71,964 | 3,652,759 |
| HOUSING UNITS, OCCUPIED, AVERAGE HOUSEHOLD SIZE BY TENURE | ||||
| Total: Map | 2.96 | 2.87 | 2.45 | 2.58 |
| Owner occupied Map | 2.99 | 2.91 | 2.51 | 2.65 |
| Renter occupied Map | 2.74 | 2.62 | 2.31 | 2.44 |
| HOUSING UNITS, OCCUPIED, TENURE BY RACE OF HOUSEHOLDER | ||||
| Owner occupied: Map | 10,862 | 16,640 | 1,181,271 | 75,986,074 |
| Householder who is White alone Map | 10,375 | 15,866 | 1,108,967 | 63,446,275 |
| Householder who is Black or African American alone Map | 221 | 366 | 50,706 | 6,261,464 |
| Householder who is American Indian and Alaska Native alone Map | 17 | 33 | 2,063 | 509,588 |
| Householder who is Asian alone Map | 150 | 172 | 7,662 | 2,688,861 |
| Householder who is Native Hawaiian and Other Pacific Islander alone Map | 5 | 8 | 254 | 61,911 |
| Householder who is Some Other Race alone Map | 26 | 82 | 3,682 | 1,975,817 |
| Householder who is Two or More Races Map | 68 | 113 | 7,937 | 1,042,158 |
| Renter occupied: Map | 1,297 | 2,791 | 538,694 | 40,730,218 |
| Householder who is White alone Map | 1,138 | 2,454 | 431,367 | 26,308,077 |
| Householder who is Black or African American alone Map | 63 | 139 | 78,150 | 7,868,519 |
| Householder who is American Indian and Alaska Native alone Map | 2 | 10 | 1,951 | 430,119 |
| Householder who is Asian alone Map | 23 | 34 | 7,814 | 1,943,303 |
| Householder who is Native Hawaiian and Other Pacific Islander alone Map | 0 | 2 | 413 | 82,021 |
| Householder who is Some Other Race alone Map | 44 | 97 | 10,074 | 2,940,610 |
| Householder who is Two or More Races Map | 27 | 55 | 8,925 | 1,157,569 |
| HOUSING UNITS, OCCUPIED, TENURE BY HISPANIC OR LATINO ORIGIN OF HOUSEHOLDER | ||||
| Owner occupied: Map | 10,862 | 16,640 | 1,181,271 | 75,986,074 |
| Not Hispanic or Latino householder Map | 10,734 | 16,385 | 1,169,209 | 69,617,625 |
| Hispanic or Latino householder Map | 128 | 255 | 12,062 | 6,368,449 |
| Renter occupied: Map | 1,297 | 2,791 | 538,694 | 40,730,218 |
| Not Hispanic or Latino householder Map | 1,203 | 2,578 | 516,776 | 33,637,301 |
| Hispanic or Latino householder Map | 94 | 213 | 21,918 | 7,092,917 |
| HOUSING UNITS, OCCUPIED, TENURE BY HOUSEHOLD SIZE | ||||
| Owner occupied: Map | 10,862 | 16,640 | 1,181,271 | 75,986,074 |
| 1-person household Map | 1,288 | 2,210 | 269,220 | 16,453,569 |
| 2-person household Map | 3,579 | 5,719 | 449,271 | 27,618,605 |
| 3-person household Map | 2,059 | 3,136 | 204,423 | 12,517,563 |
| 4-person household Map | 2,467 | 3,437 | 159,701 | 10,998,793 |
| 5-person household Map | 1,039 | 1,483 | 65,252 | 5,057,765 |
| 6-person household Map | 333 | 488 | 21,816 | 1,965,796 |
| 7-or-more-person household Map | 97 | 167 | 11,588 | 1,373,983 |
| Renter occupied: Map | 1,297 | 2,791 | 538,694 | 40,730,218 |
| 1-person household Map | 334 | 802 | 204,227 | 14,751,340 |
| 2-person household Map | 311 | 687 | 142,276 | 10,624,023 |
| 3-person household Map | 280 | 557 | 86,018 | 6,240,422 |
| 4-person household Map | 199 | 424 | 60,063 | 4,626,453 |
| 5-person household Map | 111 | 208 | 28,596 | 2,480,866 |
| 6-person household Map | 43 | 81 | 10,910 | 1,108,903 |
| 7-or-more-person household Map | 19 | 32 | 6,604 | 898,211 |
Loading...